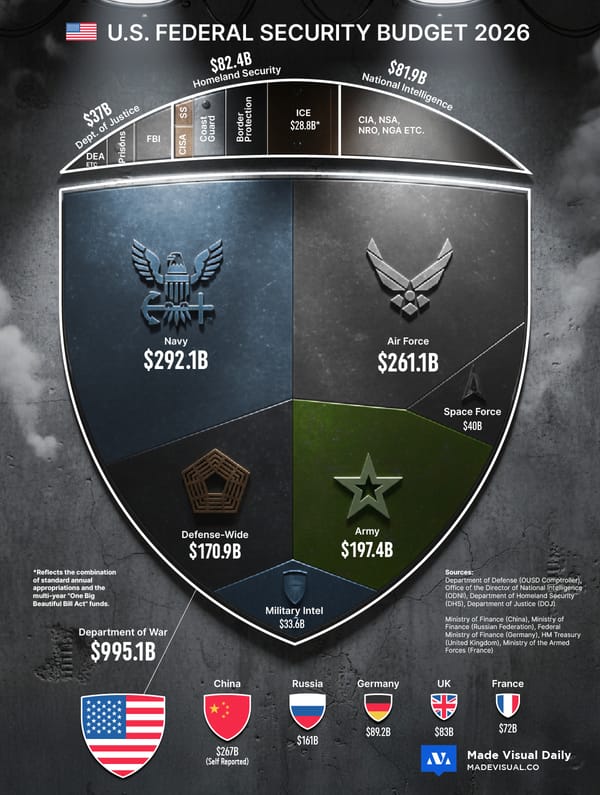
The largest trade agreements, ranked

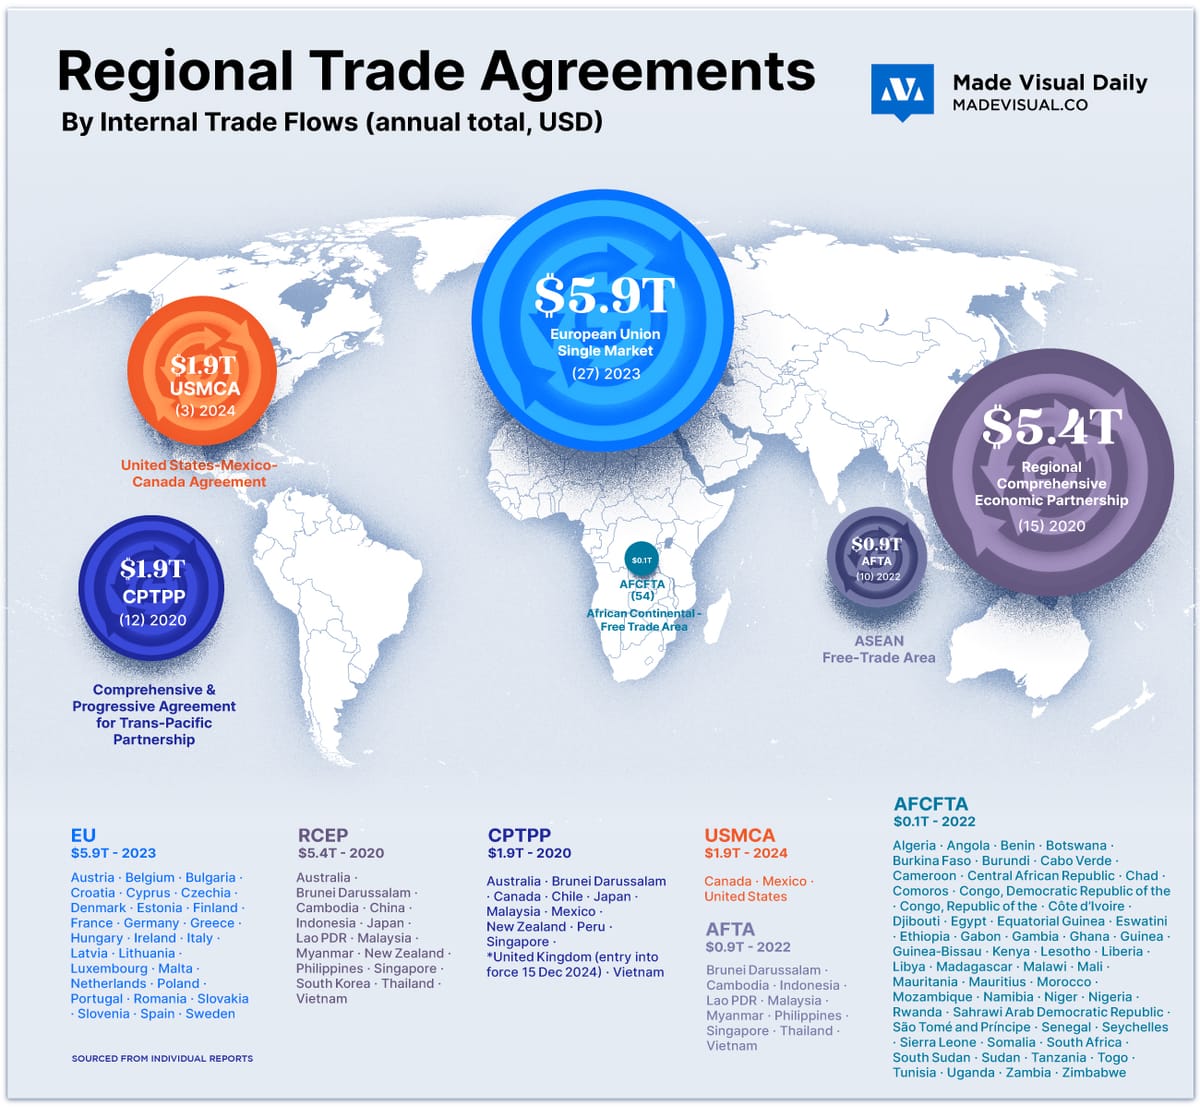
Amid warnings from the WTO that world merchandise trade could slip into outright decline this year and with Red‑Sea shipping lanes still only partly restored, the map below helps anchor where trade is still most deeply regionalised—and how big those regional arteries really are.
Three things that jump off the page
- A duopoly at the top.
The EU’s single market remains the world’s largest internal marketplace (≈ US $5.9 trn a year), but the four‑year‑old RCEP in Asia‑Pacific is already nipping at its heels on ≈ US $5.4 trn. The two blocs now account for well over half of all commerce that happens inside trade agreements. - Membership size ≠ trade heft.
AfCFTA’s 54 signatures dwarf every other pact on the map, yet its intra‑African trade sits just above US $100 bn—barely 2 % of the EU total. Conversely, USMCA’s three‑country club punches far above its weight at roughly US $1.8–1.9 trn. The graphic underlines that legal frameworks alone don’t guarantee dense trade ties; infrastructure, rules‑of‑origin discipline and production complementarities matter more. - Regional “near‑shoring” is already reality.
In 2023, goods shipped between EU members were 1.6 × larger than the bloc’s exports to the rest of the world, and manufacturing still makes up about three‑quarters of intra‑RCEP flows. In other words, many supply chains are already clustered regionally—giving firms a head‑start as they hunt for tariff‑safe or war‑safe routes.
How the numbers were built & what to watch for
- Primary sources—Eurostat (EU goods & services 2023), ERIA/UNCTAD (RCEP & CPTPP 2020 tables), USTR & national statistical offices (USMCA 2022‑24), ASEANstats (AFTA 2022 bulletin) and tralac (AfCFTA 2022 factsheet).
- Currency & coverage—Values are converted to U.S. dollars at the IMF’s average 2023 exchange rates. EU and USMCA figures bundle services; other blocs still publish goods‑only totals, so the graphic understates their full integration.
- Different vintages—Because only the EU releases 2023‑24 intra‑bloc totals, the map mixes years (2020–2024). That means the circles show scale, not strict cross‑section comparability.
- Membership changes—The CPTPP figure is from 2020 (pre‑UK entry); Britain’s first full‑year data won’t appear until 2025 statistics.
- Double‑counting—Flows inside overlapping pacts (e.g., Australia appears in both RCEP and CPTPP) are counted once per pact, so the circles should not be summed.
📌 Five related facts
- 🌍 60 %+ of world GDP now sits inside just these six regional accords.
- 💶 Germany alone ships ≈ €878 bn of goods to fellow EU members—about 21 % of all intra‑EU exports.
- 🔋 Manufacturing products make up ~75 % of intra‑RCEP trade, led by electronics and machinery.
- 🚂 In 2024, intra‑EU goods trade was 56 % bigger than the bloc’s exports to the rest of the world.
- 🌍 Intra‑Africa trade grew just 4 % in a decade—from US $98 bn in 2013 to US $102 bn in 2022.