(Part 3) Highest Grossing Animated Movies (Adjusted for Inflation)

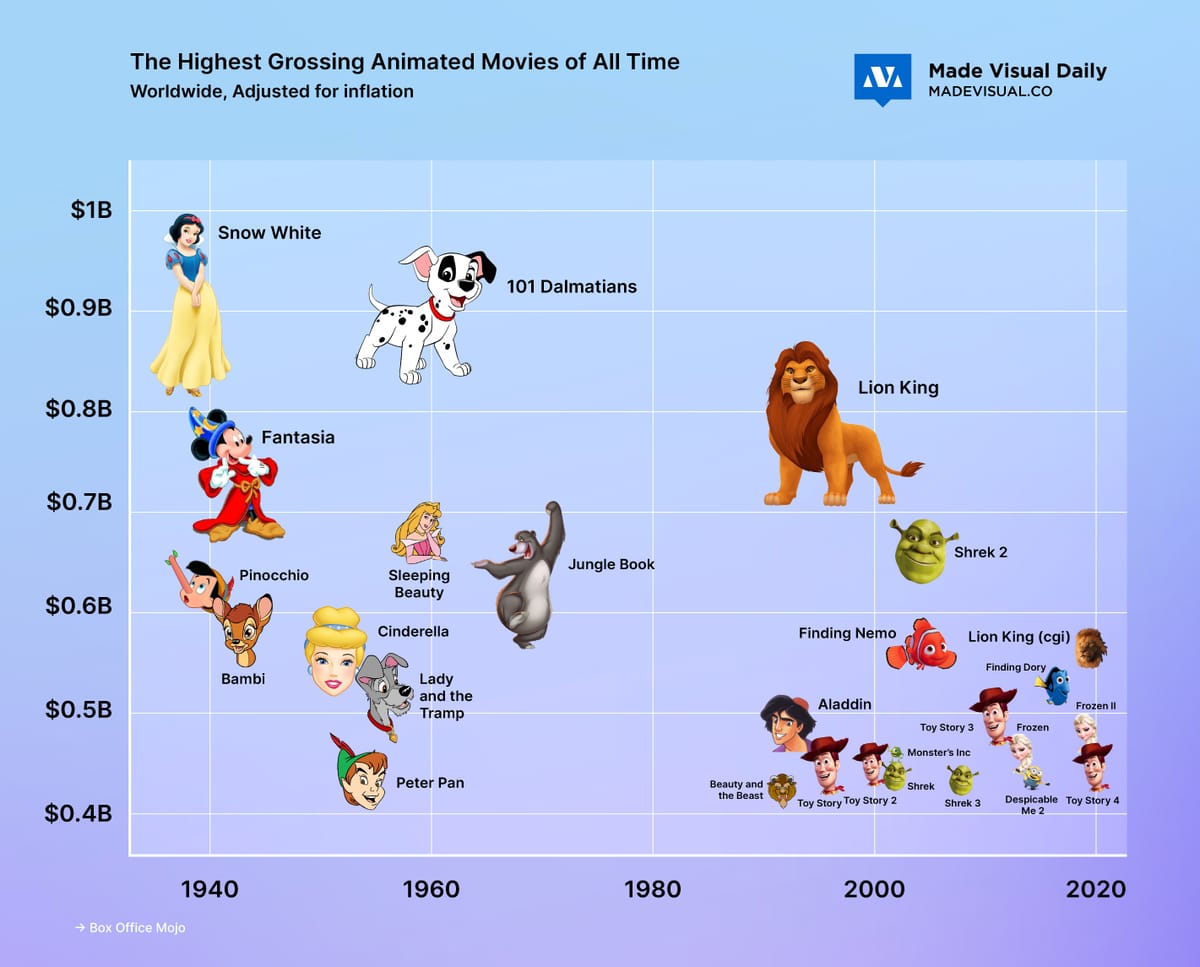
After releasing my latest graphic on the Voronoi app, the community hastily rallied around a single sentiment: this list should be adjusted for inflation.
I've heard you! Amongst other things, this required a comprehensive list of all animated films throughout history to do properly, as well as a (probably controversial) inflation adjustment for every year. Instead, I filtered the master worldwide gross list from Box Office Mojo by animated films, leaving the heavy lifting of inflation adjustment to them.
Furthermore, since the Adjusted Box Office Gross is essentially a made-up dollar amount, I thought simply plotting the movies against each other and letting readers compare for themselves was the best of all solutions!
Full list of the data below:
| Overall Rank | Title | Adjusted lifetime gross | Year |
|---|---|---|---|
| 10 | Snow White and the Seven Dwarfs | $ 997,168,333 | 1937 |
| 12 | One Hundred and One Dalmatians | $ 914,076,766 | 1961 |
| 20 | The Lion King | $ 815,540,983 | 1994 |
| 24 | Fantasia | $ 759,709,619 | 1941 |
| 34 | The Jungle Book | $ 674,048,285 | 1967 |
| 35 | Sleeping Beauty | $ 664,864,273 | 1959 |
| 38 | Shrek 2 | $ 649,997,317 | 2004 |
| 45 | Pinocchio | $ 616,627,856 | 1940 |
| 55 | Bambi | $ 582,862,273 | 1942 |
| 60 | Finding Nemo | $ 563,413,831 | 2003 |
| 63 | The Lion King (2019, photoreal CG) | $ 551,852,167 | 2019 |
| 64 | Cinderella | $ 551,657,308 | 1950 |
| 79 | Finding Dory | $ 513,753,018 | 2016 |
| 83 | Lady and the Tramp | $ 509,881,443 | 1955 |
| 102 | Toy Story 3 | $ 487,966,611 | 2010 |
| 104 | Aladdin | $ 479,759,641 | 1992 |
| 108 | Frozen II | $ 466,080,138 | 2019 |
| 114 | Monsters, Inc. | $ 452,157,290 | 2001 |
| 116 | Frozen | $ 448,852,912 | 2013 |
| 121 | Toy Story 4 | $ 440,663,324 | 2019 |
| 125 | Toy Story | $ 438,940,693 | 1995 |
| 126 | Toy Story 2 | $ 437,624,247 | 1999 |
| 128 | Shrek | $ 432,630,172 | 2001 |
| 129 | Shrek the Third | $ 429,120,872 | 2007 |
| 130 | Despicable Me 2 | $ 429,002,858 | 2013 |
| 140 | Peter Pan | $ 417,378,986 | 1953 |
| 143 | Beauty and the Beast | $ 415,002,249 | 1991 |
| 160 | The Secret Life of Pets | $ 395,883,147 | 2016 |
| 167 | Inside Out | $ 388,927,669 | 2015 |
| 175 | The Incredibles | $ 384,504,450 | 2004 |
| 185 | Minions | $ 372,467,073 | 2015 |
| 199 | Zootopia | $ 362,329,805 | 2016 |
| 204 | Up | $ 359,289,814 | 2009 |
| 225 | Cars | $ 340,908,982 | 2006 |
| 261 | A Bug’s Life | $ 312,282,932 | 1998 |
| 271 | Tarzan | $ 308,055,488 | 1999 |
| 276 | Monsters University | $ 303,728,326 | 2013 |
| 285 | Despicable Me | $ 298,185,351 | 2010 |
| 286 | Pocahontas | $ 297,751,720 | 1995 |
| 289 | The Lego Movie | $ 295,631,136 | 2014 |
| 309 | WALL·E | $ 285,161,783 | 2008 |
| 319 | Sing | $ 280,598,595 | 2016 |
| 326 | Ice Age | $ 277,736,996 | 2002 |
| 328 | Shrek Forever After | $ 277,478,098 | 2010 |
| 329 | Madagascar | $ 276,298,878 | 2005 |
| 333 | The Grinch (2018) | $ 274,599,118 | 2018 |
| 334 | Happy Feet | $ 274,557,035 | 2006 |
| 335 | Ratatouille | $ 274,510,379 | 2007 |
| 336 | Kung Fu Panda | $ 274,493,912 | 2008 |
| 338 | Brave | $ 274,061,196 | 2012 |
| 343 | Ice Age: The Meltdown | $ 272,817,022 | 2006 |
| 344 | The Polar Express | $ 271,868,340 | 2004 |
| 346 | Despicable Me 3 | $ 271,018,460 | 2017 |
| 379 | Moana | $ 258,601,427 | 2016 |
| 393 | How to Train Your Dragon | $ 252,669,648 | 2010 |
Thanks for joining me on this kind of random journey. More other content to come! 😄


